Online Reporter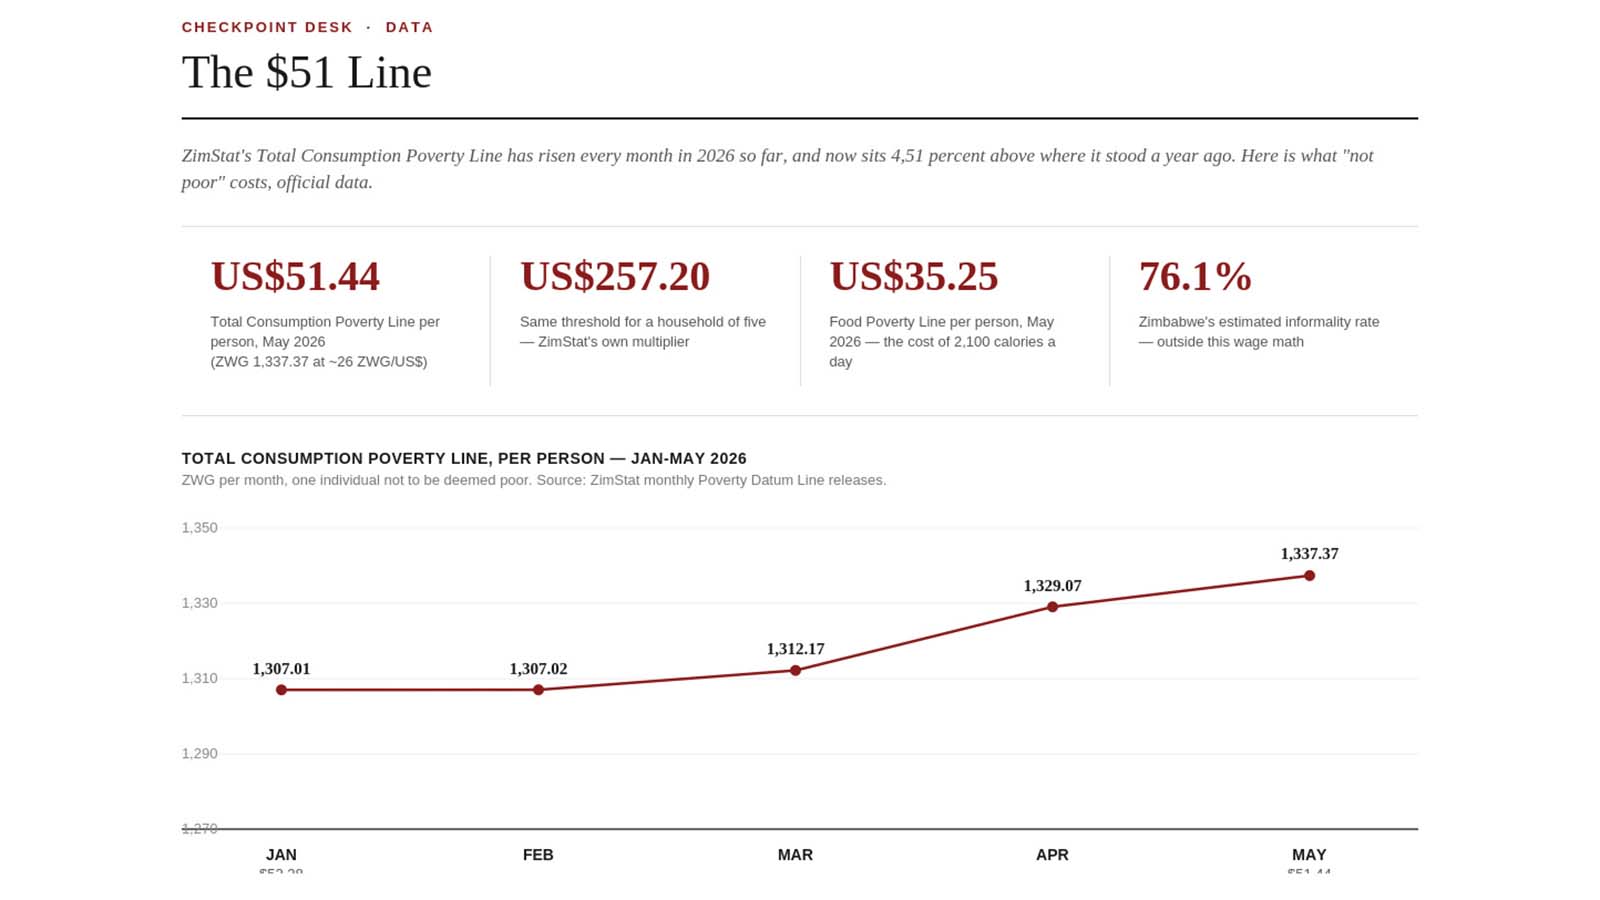
Tawanda Musarurwa
CHECKPOINT DESK
FIFTY-ONE dollars and forty-four cents.
That is what the Zimbabwe National Statistics Agency (ZimStat) says stood between an average Zimbabwean and poverty in May 2026, for a whole month, food and everything else included.
It is a surprisingly precise number for something as complex as poverty: ZiG1 337,37, converted at the interbank rate of roughly 26 to the dollar, is May 2026’s Total Consumption Poverty Line (TCPL) per person, according to ZimStat’s latest Poverty Datum Line release.
That is up 0,62 percent on April and 4,51 percent higher than a year earlier.
Below it sits the Food Poverty Line: ZiG916,59, or US$35,25 (the line beneath which a person is hungry-poor, unable to afford 2 100 calories a day).
What does US$51 actually buy?
A survey carried out by Checkpoint Desk at one supermarket in Harare found that a basic one-person monthly basket – 10kg roller meal, 2L cooking oil, 2kg sugar, 1kg salt, 2kg rice, 500g sugar beans, four loaves of bread, four litres of UHT milk, 30 eggs, a kilogramme each of tomatoes, onions and potatoes, two cabbages and a kilogramme of bananas – costs US$39,27, already exceeding ZimStat’s US$35,25 Food Poverty Line.
That leaves just US$12,17 of the US$51,44 Total Consumption Poverty Line for everything else a household needs that month.
The most affordable toothpaste, bath soap, a laundry bar and toilet tissue alone come to US$4,39, leaving roughly US$7,78 for transport, electricity, healthcare, education and clothing combined; a month’s worth of survival that the official number simply does not stretch to cover, before a single dollar is spent on rent or a single cent on meat.
In practice, many households bridge that gap through remittances, informal trading income, own-produced food, or simply going without.
For 38-year-old Mrs Tendai Chikwanha (not her real name), a vendor at Mbare Musika and mother of three, that arithmetic plays out every month at the till.
Mrs Chikwanha does the family’s grocery shopping for herself, her husband and their children.
“We spend close to US$90 a month just on groceries for the five of us. Mealie meal is US$7 for a 10kg bag, and with three children it doesn’t even last us the full month,” she said.
“Cooking oil, sugar, salt, rice and soap add another US$25 or so. Then there’s bread, milk and relish. After groceries there’s still school fees, transport to work, electricity tokens. Some things have to wait.”
For a household of five, ZimStat’s methodology implies a monthly Total Consumption Poverty Line of roughly US$257,20. Mrs Chikwanha’s grocery bill alone absorbs more than a third of that before transport, school fees, electricity or rent enter the picture.
Two baskets, two realities
The Consumer Council of Zimbabwe’s own numbers tell much the same story, from a different angle.
CCZ says its family basket, which prices the monthly cost of essentials for a household of six, climbed to US$616,43 in March 2026, pushed up by higher transport and fuel costs.
Scaled down to a single person, that works out to roughly US$102,74 – more than double ZimStat’s US$51,44 threshold.
Measured against the same month, ZimStat’s own line implies a six-person household needs about US$302,79 to stay out of poverty; CCZ’s basket puts the real figure at over double that.
Two organisations, pricing the same country in the same season, arrive at answers more than US$300 apart.
Not all poverty looks the same
But, the national figure is more complicated. ZimStat’s province-level breakdown for May shows a Harare resident needed US$57,91 to clear the poverty line – the highest of any province – against US$56,94 in Bulawayo, US$48,07 in Manicaland (home to Mutare) and just US$45,07 in Masvingo, the cheapest province in the country to be officially “not poor.”
The cost of not being poor, in other words, already varies by nearly US$13 depending on where in Zimbabwe you live, before anyone has bought a single tomato.
That regional gap becomes far starker once poverty prevalence, rather than the cost of the line, is measured.
The ZimStat/UNICEF Zimbabwe Poverty Atlas, built from the same 2017 household survey that underpins today’s PDL, found that people poverty prevalence nationally stood at 53,1 percent under the total consumption poverty lower line, with 30,8 percent living in extreme poverty.
The Atlas’ district-level detail is where the story sharpens. Harare Urban District had a people poverty rate of 9,4 percent – lower than Bulawayo’s 14,9 percent – yet in the same Harare province, Chitungwiza’s rate was 29,3 percent, Epworth’s 46,7 percent and Harare Rural, a sparsely populated rural ward that falls administratively under Harare province rather than the city itself, recorded a poverty rate of 100 percent.
The report itself notes this is “an example of an urban area with high poverty rates”.
Mutare tells a similar story in miniature. Mutare Urban’s poverty rate was 14,9 percent, respectable by national standards, but Manicaland’s rural districts told a different truth entirely: Chipinge rural recorded a 79,8 percent poverty rate, followed by Buhera with 79,3 percent, while the lowest among rural districts, Chimanimani, still sat at 62,7 percent.
Across Manicaland as a whole, 65 percent of people were classified as poor and 37,5 percent as extremely poor.
A poverty line built on 2017 assumptions
The difference between the numbers and lived reality becomes easier to understand once you look at how the poverty line is built.
The Food and Total Consumption Poverty Lines are still anchored in the 2017 Poverty, Income, Consumption and Expenditure Survey (PICES), a ZimStat exercise covering 32 256 households nationally, with a 96,7 percent response rate.
That survey found the average Zimbabwean household spent US$3 101 a year on cash and non-cash consumption, of which 33,2 percent went to food and non-alcoholic beverages.
But that national average conceals the same regional pattern the 2026 numbers still show: Harare households spent US$1 084 a year on food against Bulawayo’s US$999, while poorer provinces spent far less in dollar terms but a far higher share of their budgets. Food consumed as much as 43,1 percent of total spending in Mashonaland Central and Matabeleland South, against just 25,9 percent in Bulawayo and 30,5 percent in Harare.
Poorer provinces in 2017 were already spending proportionally more just to eat, and the poverty line built on that data has changed only its prices since, not its assumptions about what households buy or in what quantities.
The PICES survey found an average household size of 4,2 people, not the round five often used in public discussions of poverty lines. The “family of five” benchmark is a communication shortcut, not a real household.
Layered onto this is the informal economy. Zimbabwe’s PICES data already showed in 2017 that 67 percent of rural households relied on sale of their own agricultural produce as their main income source, against 63,9 percent of urban households relying on salaries and wages, two entirely different relationships to a poverty line that assumes a wage.
Today’s estimated 76,1 percent informality rate suggests that gap has only widened.
None of this means ZimStat’s US$51,44 figure is fabricated.
It is transparent, methodologically consistent and, crucially, comparable over time, which is exactly what makes it useful as a baseline.
Economist Mr Trust Chikohora says poverty lines are not intended to capture every nuance of household welfare, but rather to serve as a broadly comparable statistical benchmark.
“They are a reasonable generally-accepted statistical indicator of the poverty situation in a country. So, they do give us an indication and allow us to compare from time to time and between countries.”
ZimStat itself is careful to note its poverty methodology is not designed to be read against basket-based cost-of-living series like the CCZ’s, which price actual commodities rather than a fixed historical diet.
But, baselines are not lived reality. A Harare Urban resident and a Chipinge rural resident are being measured against different local price levels, however the second is roughly five times more likely to be poor.
The data says $51. The methodology has remained largely unchanged since 2017, even as currencies, prices and livelihoods have shifted around it.